top of page


PHYSICS
Unit 1: Motion - Distance, Speed and Acceleration Time graphs
Theme: Globalization and sustainability
SOI: Understanding motion and its relationships inspired mankind to create machines resulting in impact on the environment
KC: Relationship
RC: Consequences and Movement
The specific rules that applies to everything that exists
Graphs help visualize how fast an object is actually travelling.
let me explain my understanding of it using this example.

Falcon 9 launch
This launch happened last year when the Falcon 9 by SpaceX carried 2 astronauts from earth to the international space station.
What I have done is taken this video and use it as an experiment, to show you how we can understand distance, speed, and Acceleration using graphs.
The Data
We have Time (s & hr), distance (km), speed (kph),which I have noted down for every 10sec intervals and the calculated acceleration (speed2 - speed1)/(time2 - time1).

The Graphs
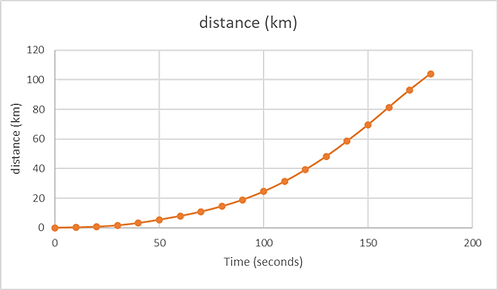
First graph: This is the distance that the rocket travelled.
Second graph: This is the speed graph, to show the speed at specific times of the journey. You can also see how the speed varies. At a certain point the rocket stabilizes its speed.

Third graph: The acceleration graph to show you how the velocity changes throughout the journey.
Note that when the rocket slows down, the acceleration is actually negative.

So, the results show that the rocket travelled a total of 104 km in 180 seconds (3 minutes). The speed of the rocket was the highest at 160 seconds, coming close to 7000 kph. The acceleration, however, was highest at 140- 150 seconds, which shows that the rocket was slowing down before it reached its destination. We can also see that when the speed reduces, we see negative acceleration (deceleration).
bottom of page